Definition of Technical Analysis
Technical analysis is the process of utilizing past trading information and stock price trends related to a specific security, and then equating those to how other likewise investments have responded throughout history to similar patterns. Further, when a pattern is identified, the investor can predict that the future pricing of the target investment is likely to respond in a similar manner to patterns observed earlier.
Technical analysis of stocks assumes that current prices should represent all known information about the markets. Prices not only reflect intrinsic facts, they also represent human emotion and the pervasive mass psychology and mood of the moment. Prices are, in the end, a function of supply and demand. However, on a moment to moment basis, human emotions,fear, greed, panic, hysteria, elation, etc. also dramatically affect prices. Markets may move based upon people’s expectations, not necessarily facts. A market “technician” attempts to disregard the emotional component of trading by making his decisions based upon chart formations, assuming that prices reflect both facts and emotion.
Technical analysis is based on the study if past market data associated with volume and price with the primary purpose of forecasting future price movements. Furthermore, technical analysis is not used for making sheer prediction; instead it assists in projecting the potential price movement across time. Functionally speaking, technical analysis can be applied to commodities, futures, stocks, forex or foreign exchange, indices or any tradable entity, whose price is driven by supply and demand trends of the market. Additionally, it is employed by day traders as well as short-term investors who participate in investment markets, including foreign exchange market and the stock market. Hedgers are also active users of this form of analysis.
Analysts use their technical research to decide whether the current market is a BULL MARKET or a BEAR MARKET.
How does Technical Analysis Work?
Technical analysis is carried out on the premise that price discounts each individual aspect and data in the market. This type of analysis is also driven by the belief that price movements are not entirely arbitrary and rely on a trend. A technical analyst, through technical analysis, is enabled to detect an ongoing trend, trade on the basis of the trend and produce profits as the trend proceeds.
Following are the methods used for performing technical analysis:
1. STOCK CHARTS
A stock chart is a simple two-axis (X-Y) plotted graph of price and time. Each individual equity, market and index listed on a public exchange has a chart that illustrates this movement of price over time. Individual data plots for charts can be made using the CLOSING price for each day. The plots are connected together in a single line, creating the graph. Also, a combination of the OPENING, CLOSING, HIGH and/or LOW prices for that market session can be used for the data plots. This second type of data is called a PRICE BAR. Individual price bars are then overlaid onto the graph, creating a dense visual display of stock movement. Stock charts can be drawn in two different ways. An ARITHMETIC chart has equal vertical distances between each unit of price. A LOGARITHMIC chart is a percentage growth chart.
2. TRENDS
The stock chart is used to identify the current trend. A trend reflects the average rate of change in a stock’s price over time. Trends exist in all time frames and all markets. Trends can be classified in three ways: UP, DOWN or RANGE-BOUND. In an uptrend, a stock rallies often with intermediate periods of consolidation or movement against the trend. In doing so, it draws a series of higher highs and higher lows on the stock chart. In an uptrend, there will be a POSITIVE rate of price change over time. In a downtrend, a stock declines often with intermediate periods of consolidation or movement against the trend. In doing so, it draws a series of lower highs and lower lows on the stock chart. In a downtrend, there will be a NEGATIVE rate of price change over time. Range bound price swings back and forth for long periods between easily seen upper and lower limits. There is no apparent direction to the price movement on the stock chart and there will be LITTLE or NO rate of price change. Trends tend to persist over time. A stock in an uptrend will continue to rise until some change in value or a condition occurs. Declining stocks will continue to fall until some change in value or conditions occur. Chart readers try to locate TOPS and BOTTOMS, which are those points where a rally or a decline ends. Taking a position near a top or a bottom can be very profitable. Trends can be measured using TRENDLINES. Very often a straight line can be drawn UNDER three or more pullbacks from rallies or OVER pullbacks from declines. When price bars return to that trend line, they tend to find SUPPORT or RESISTANCE and bounce off the line in the opposite direction.

3. VOLUME
Volume measures the participation of the crowd. Stock charts display volume through individual HISTOGRAMS below the price pane. Often these will show green bars for up days and red bars for down days. Investors and traders can measure buying and selling interest by watching how many up or down days in a row occur and how their volume compares with days in which price moves in the opposite direction. Stocks that are bought with greater interest than sold are said to be under ACCUMULATION. Stocks that are sold with great interest than bought are said to be under DISTRIBUTION. Accumulation and distribution often LEAD to price movement. In other words, stocks under accumulation often will rise some time after the buying begins. Alternatively, stocks under distribution will often fall some time after selling begins. It takes volume for a stock to rise but it can fall of its own weight. Rallies require the enthusiastic participation of the crowd. When a rally runs out of new participants, a stock can easily fall. Investors and traders use indicators such as ON BALANCE VOLUME to see whether participation is lagging (behind) or leading (ahead) the price action. Stocks trade daily with an average volume that determines their LIQUIDITY. Liquid stocks are very easy for traders to buy and sell. Liquid stocks require very high SPREADS (transaction costs) to buy or sell and often cannot be eliminated quickly from a portfolio. Stock chart analysis does not work well on illiquid stocks.

4. PATTERNS AND INDICATORS
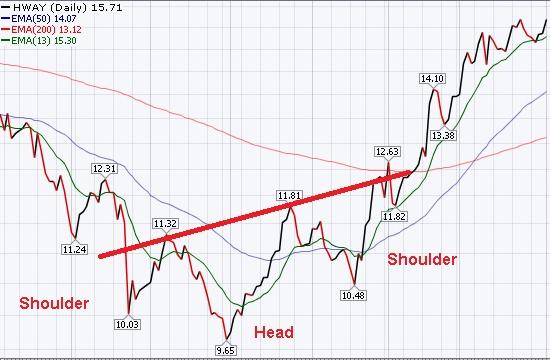
Charts allow investors and traders to look at past and present price action in order to make reasonable predictions and wise choices. It is a highly visual medium. This one fact separates it from the colder world of value- based analysis. The stock chart activates both left-brain and right-brain functions of logic and creativity. So it’s no surprise that over the last century two forms of analysis have developed that focus along these lines of critical examination. The oldest form of interpreting charts is PATTERN ANALYSIS. This method gained popularity through both the writings of Charles Dow and Technical Analysis of Stock Trends, a classic book written on the subject just after World War II. The newer form of interpretation is INDICATOR ANALYSIS, a math-oriented examination in which the basic elements of price and volume are run through a series of calculations in order to predict where price will go next. Pattern analysis gains its power from the tendency of charts to repeat the same bar formations over and over again. These patterns have been categorized over the years as having a bullish or bearish bias. Some well-known ones include HEAD and SHOULDERS, TRIANGLES, RECTANGLES, DOUBLE TOPS, DOUBLE BOTTOMS and FLAGS. Also, chart landscape features such as GAPS and TRENDLINES are said to have great significance on the future course of price action. Indicator analysis uses math calculations to measure the relationship of current price to past price action. Almost all indicators can be categorized as TREND-FOLLOWING or OSCILLATORS. Popular trend-following indicators include MOVING AVERAGES, ON BALANCE VOLUME and MACD. Common oscillators include STOCHASTICS, RSI and RATE OF CHANGE. Trend following indicators react much more slowly than oscillators. They look deeply into the rear view mirror to locate the future. Oscillators react very quickly to short-term changes in price, flipping back and forth between OVERBOUGHT and OVERSOLD levels. Both patterns and indicators measure market psychology. The core of investors and traders that make up the market each day tend to act with a herd mentality as price rises and falls. This “crowd” tends to develop known characteristics that repeat themselves over and over again. Chart interpretation using these two important analysis tools uncovers growing stress within the crowd that should eventually translate into price change.
5. MOVING AVERAGES
The most popular technical indicator for studying stock charts is the MOVING AVERAGE. This versatile tool has many important uses for investors and traders. Take the sum of any number of previous CLOSE prices and then divide it by that same number. This creates an average price for that stock in that period of time. A moving average can be displayed by re-computing this result daily and plotting it in the same graphic pane as the price bars. In other words, if price starts to move sharply upward or downward, it will take some time for the moving average to “catch up”. Plotting moving averages in stock charts reveals how well current price is behaving as compared to the past. The power of the moving average line comes from its direct interaction with the price bars. Current price will always be above or below any moving average computation. When it is above, conditions are “bullish”. When below, conditions are “bearish”. Additionally, moving averages will slope upward or downward over time. This adds another visual dimension to a stock analysis. Moving averages define STOCK TRENDS. They can be computed for any period of time. Investors and traders find them most helpful when they provide input about the SHORT-TERM, INTERMEDIATE and LONG-TERM trends. For this reason, using multiple moving averages that reflect these characteristics assist important decision making. Commons moving average settings for daily stock charts are 20 days for short term, 50 days for intermediate and 200 days for long-term. One of the most common buy or sell signals in all chart analysis is the MOVING AVERAGE CROSSOVER. These occur when two moving averages representing different trends. For example, when a short-term average crosses BELOW a long-term one, a SELL signal is generated. Conversely, when a short term crosses ABOVE the long-term, a BUY signal is generated. Moving averages can be “speeded up” through the application of further math calculations. Common averages are known as SIMPLE or SMA. These tend to be very slow. By giving more weight to the current changes in price rather than those many bars ago, a faster EXPONENTIAL or EMA moving average can be created. Many technicians favor the EMA over the SMA. Fortunately all common stock chart programs, online and offline do the difficult moving average calculations but plot price perfectly.

6. SUPPORT AND RESISTANCE
The concept of SUPPORT AND RESISTANCE is essential to understanding and interpreting stock charts. Just as a ball bounces when it hits the floor or drops after being thrown to the ceiling, support and resistance defines natural boundaries for rising and falling prices. Buyers and sellers are constantly in battle mode. Support defines that level where buyers are strong enough to keep price from falling further. Resistance defines that level where sellers are too strong to allow price to rise further. Support and resistance play different roles in up-trends and down-trends. In an uptrend, support is where a pullback from a rally should end. In a downtrend, resistance is where a pullback from a decline should end. Support and resistance are created because price has memory. Those prices where significant buyers or sellers entered the market in the past will tend to generate a similar mix of participants when price again returns to that level. When price pushes above resistance, it becomes a new support level. When price falls below support, that level becomes resistance. When a level of support or resistance is penetrated, price tends to thrust forward sharply as the crowd notices the BREAKOUT and jumps in to buy or sell. When a level is penetrated but does not attract a crowd of buyers or sellers, it often falls back below the old support or resistance. This failure is known as a FALSE BREAKOUT. Support and resistance come in all varieties and strengths. They most often manifest as horizontal price levels. But trend lines at various angles represent support and resistance as well. The length of time that a support or resistance level exists determines the strength or weakness of that level. The strength or weakness determines how much buying or selling interest will be required to break the level. Also, the greater volume traded at any level, the stronger that level will be. Support and resistance exist in all time frames and all markets. Levels in longer time frames are stronger than those in shorter time frames.

The ideas of Charles Dow (The Dow Jones Theory on Stock Market Movements), the first editor of the Wall Street Journal, form the basis of technical analysis of stocks today. The behavior patterns that he observed apply to markets throughout the world.
Advantages and Disadvantages of Technical Analysis
Advantages of Technical Analysis
- Powerful focus on price movement: The key focus of technical analysis is laid on the movement of prices. In other words, charts are used for depicting how prices move or don’t move, when prices trend, and the strength of those trends. Further, volume, momentum and oscillators show a clearer image in regards to market action. This information can be acquired at a glance. Technicians, unlike fundamentalists, do not employ economic reports which examine the demand for a particular currency.
- Patterns are easily found: One of the fundamental aspects of market action is that it re-generates itself in clean, accurate patterns. Charts enables and aids the trader to identify patterns and forecast the price movements on the basis of these patterns. Similar to start constellations, charts and patterns can be composite and complicated. In essence, head-and-shoulder patterns, round tops and bottoms, descending and ascending triangles, as well as double and triple tops are highly effective patterns followed by several currency prices. Therefore, they possess powerful predictive capabilities. Also, they cannot be detected without using a chart.
- Trends are easily detected: With just a glance at a moving averages line instantly shows a price that is stuck or trending in a range. A chart can immediately display a currency which exhibits a trend, whether or not it is up, down, or oblique. Trends are vital to technicians since a currency will continue to move in the direction of the trend, and these trends can be clearly and accurately shown by charts.
- Charting is fast and cheap: As computer workstations have relieved most individuals from the burden of doing complicated mathematical operations, the Internet holds a pool of various technical indicators which help the trader to make more reliable and more productive trades. Several brokers provide to their clients, such forms of technical indicators as part of their package. Toward that end, technical analysis is inexpensive, less time consuming, as compared to fundamental analysis. It can also be performed within a few countable minutes and the services are most commonly offered for free or at a low price.
- Charts offer a wealth of data: Indicators and charts are capable of offering a massive quantity of information. Trends can easily be detected; resistance as well as support levels are instantly found. Volatility, momentum and trading forms are quickly and easily accessible. There exist greater than fifty types of indictors and each offers crucial information on various aspects regarding the exact movement of a currency. This information is said to be vital to technicians for making sound and productive trades.
Additionally, charts depict the representation of the price movement and personality of a currency. This representation can be complicated with several different kinds of ups and downs in terms of the data distribution. Furthermore, charts can provide only the fundamental information on a trend or resistance and support. Nonetheless, they become much more profound in providing information regarding the intensity of a trend, how momentum is heightening, and whether or not formations are being developed that can allow trading.
Disadvantages of Technical Analysis
As Technical analysis is employed by numerous traders worldwide, for trading stocks, it is attractive as it is driven by mathematics and statistics, thereby giving outputs as the illusion of correctness and predictability. Nevertheless, technical analysis is equipped with several flaws which trader should be aware of. The limitations of technical analysis of stocks are as following:
- At the core, every technical indicator, irrespective of how its complexity, is based on price, which is a mere reflection of what has already taken place in the market. Therefore, technical analysis is said to be highly reactive and not truly predictive about what will happen.
- Currently, markets are much more disorderly and jerky in comparison to earlier decades. This is due to hedge funds as well as automated ultra-short term trading. Consequently, the result is more false signs and non-uniform patterns from technical analysis methods.
- Almost all technical traders try their hand at trend-following. Even while trend following method are capable of making big money over time; however, they also have a low rate of accuracy and a high draw down. A good example of this is that most trades are complete losses and are very common to be down by 50 to 60% at a given point. Furthermore, several traders are unable to handle this after-effect psychologically, and end up overriding trading signals and changing between systems.
- A major flaw indicates that the bulk of technical traders continue relying on certain indicators that were first created during the 1970’s. As a consequence, traders tend to overuse these indicators and, therefore, the markets render them less efficient.
- Classical trading chart patterns may be seen in graphs of non-market pertained actions, such as temperature charts. Additionally, chart patterns may appear as well as disappear according to the scaling of the chart. And this strongly advises that chart patterns are nothing but a trick of the human eye and do not have any predictive value.