Given the Isoproduct map, the producer would like to ride on the highest possible Isoquant because any point on it would yield maximum possible output. But the producer’s desires are limited by his budgetary constraints. Before he selects a certain combination of inputs he has to take into consideration the size of his investment outlay and the prices of the factors of production.
The Isocost Line
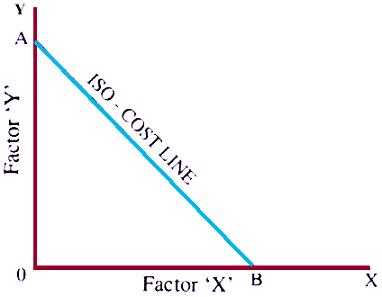
Let us assume that the investment fund is given and the prices of factors X and Y are also known. On the basis of these assumptions let us suppose that the firm were to spend the entire amount on employing units of only input X. Then it could hireOB units of factor X. On the other hand if the producer wants to allocate his entire investment outlay in employing factor Y then he could hire OA units of Y. We have now obtained the two extreme situations A and B.
When we join the points A and B we get the Isocost line. The Isocost line is so called because whatever be the combination of factor inputs we select at any point on this line we shall obtain that combination at the same total cost. Thus line AB is also called the equal cost line.
Producers Equilibrium with Isoquants and Isocost Lines
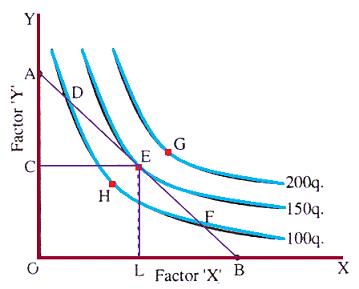
When we superimpose the Isoquant map on the Isocost line then we observe that certain Isoquants lie above the Isocost line. Some may lie below it. Others may cut and touch it. The Isoquant 200q lies above the Isocost line. Therefore it is beyond the economic reach ofthe producer. He would have preferred to ride on the Isoquant 200q but his investment outlay does not permit him to enjoy any such factor combination which could yield 200q. His choice of factor inputs is thus restricted by a given investment fund. Thus points similar to G on Isoquants above the Isocost line are beyond the producer’s economic reach. Let us now consider any point below the Isocost line. Such points will be within the reach of the producer but will not exhaust his investment outlay and thus will not fetch the maximum possible return. Points D and F are on the Isocost line itself, showing that the producer can afford these factor-combinations but they would yield only 100q. Thus between points D, E and F, point E would be most preferred; because at E the factor-input combination costs the same as at points D and F but the level of output at E is higher than at D or F. Therefore, the producer will finally settle down at point E. At point E, the Iso-cost line is a tangent to the Isoquant. Thus, the tangency between Isocost line and Isoquant represents the point of producer’s equilibrium.
At point E, the slope of Isocost line and the slope of Isoquant is the same. Now slope of Isoquant gives us the MRTS and the slope of Isocost line denotes the ratio of prices of factors i.e. Px/Py and since at point E, both slopes are the same; therefore at point E,
MRTS = Px/Py
Thus, the producer is in equilibrium at the point of tangency between the Isocost line and the Isoproduct curve. This is the best possible point of factor combination within the budget constraints.
Download PowerPoint Presentation: Producers-Equilibrium (pptx)

