The Gantt chart is an important framework for designing a proper time plan when carrying out a certain project. Gantt chart can be defined as a tool for depicting a schedule graphically in the form of bars and lines, which lets stakeholders see the timeline of a project more clearly. Since the Gantt chart is generally a popular tool, it is used by numerous organizations operating in different spheres with an intention to have a better understanding of the time limits of their projects. For instance, the Gantt chart is useful for construction projects with deadlines and multiple contractors whose efforts must be coordinated.
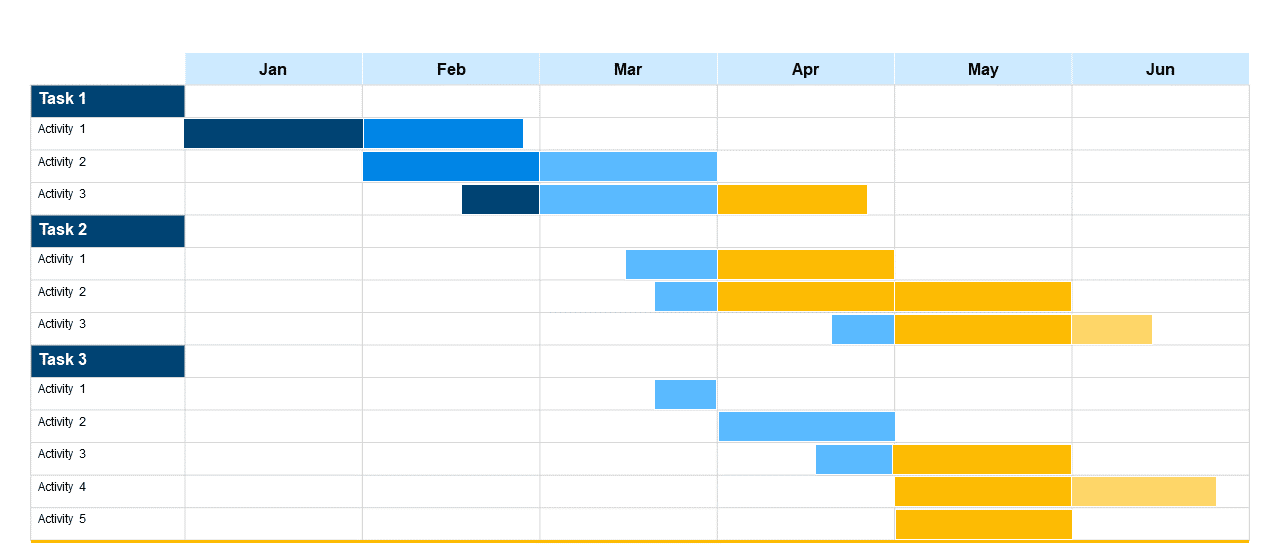
The Gantt chart lists the construction tasks that need to be performed down a single column, generally in the order in which they are to be carried out, along with a second column indicating the length of time required to complete each task. At the top of the chart, dates for the construction project are noted in a horizontal row. To the right of each task a line/bar indicates the starting date to the completion date for that task. All tasks in the first column are charted in this manner across the rows of the chart, with the bar for each task beginning at the earliest possible starting date. Many tasks must be completed in sequence, requiring the completion of one activity before the next can be started, although some tasks may be completed independently of other work and can be charted when the work is most convenient.
The charting of activities allows the project manager to identify critical points in the construction schedule and provides the opportunity to adjust the tasks to meet schedule demands. Gantt charting is useful for small projects that must be completed in a linear manner, or one step after the other, and for contractors who have small crews and can only engage in one activity at a time.
Most Gantt charts these days are constructed using computer scheduling programs. Templates provide a listing of typical construction tasks so the project manager only has to insert the duration of the work; scheduling programs have advanced to the point where data about the activities, such as duration and sequence, can be provided and the entire chart generated
By using the Gantt chart, the construction managers can easily plan the schedule of the whole project and ensure efficient use of time. Gantt charts are also important in IT project management since they help to track activities that have to be performed to complete a project successfully. As a result, when implementing new solutions, IT managers can utilize Gantt charts to plan their actions more carefully.
It is clear that Gantt charts are extremely convenient for keeping track of all vital activities related to work on a project. Gantt charts communicate a project timeline not only to the main individuals in charge of a certain project but to every stakeholder involved in it. In other words, Gantt charts show the precedence and order of tasks that have to be completed by their respective deadlines, as well as communication activities that can be undertaken simultaneously. Since Gantt charts graphically depict every task, managers have an opportunity to assess how much resources they will allocate to each one.
Gantt charts have been used by people for over a hundred years since the first concept of such a chart was first introduced at the beginning of the 20th century. Namely, Henry Gantt was the man who designed the first-ever schedule with the use of bar charts. The first Gantt charts were used widely by the U.S. Army during the first world war, but then gradually, the tool became more popular among businesses that also started featuring them. Nevertheless, Gantt charts experienced the most prominent proliferation during the 1980s when many people began installing their personal computers. Special software for making Gantt charts also emerged during the same era, which enabled more organizations to embrace the tool and integrate it into their operations.
Gantt chart, despite its usefulness and effectiveness, has certain disadvantages which can translate into challenges during implementation. For instance, on large projects, it can be difficult to track progress by simply assessing Gantt charts. Projects involving numerous stakeholders rely on multiple types of communication, including update reports, milestones, emails, and progress statements which simply cannot be incorporated into Gantt charts. Additionally, once a project begins, certain deadlines are likely to change, which will cause people in charge of the chart to update it. It can be challenging to distribute an updated version of a Gantt chart among all stakeholders each time there is a change in the timeline.