A proper understanding of the nature and behavior of costs is a must for regulation and control of cost of production. The cost of production depends on money forces and an understanding of the functional relationship of cost to various forces will help us to take various decisions. Output is an important factor, which influences the cost.
The cost-output relationship plays an important role in determining the optimum level of production. Knowledge of the cost-output relation helps the manager in cost control, profit prediction, pricing, promotion etc. The relation between cost and its determinants is technically described as the cost function.
C= f (S, O, P, T ….)
Where;
- C= Cost (Unit or total cost)
- S= Size of plant/scale of production
- O= Output level
- P= Prices of inputs
- T= Technology
Considering the period the cost function can be classified as (1) short-run cost function and (2) long-run cost function. In economics theory, the short-run is defined as that period during which the physical capacity of the firm is fixed and the output can be increased only by using the existing capacity allows to bring changes in output by physical capacity of the firm.
1. Cost-Output Relationship in the Short-Run
The cost concepts made use of in the cost behavior are Total cost, Average cost, and Marginal cost.
Total cost is the actual money spent to produce a particular quantity of output. Total Cost is the summation of Fixed Costs and Variable Costs.
TC=TFC+TVC
Up to a certain level of production Total Fixed Cost i.e., the cost of plant, building, equipment etc, remains fixed. But the Total Variable Cost i.e., the cost of labor, raw materials etc., vary with the variation in output. Average cost is the total cost per unit. It can be found out as follows.
AC=TC/Q
The total of Average Fixed Cost (TFC/Q) keep coming down as the production is increased and Average Variable Cost (TVC/Q) will remain constant at any level of output.
Marginal Cost is the addition to the total cost due to the production of an additional unit of product. It can be arrived at by dividing the change in total cost by the change in total output.
In the short-run there will not be any change in Total Fixed C0st. Hence change in total cost implies change in Total Variable Cost only.
|
Units of Output Q |
Total fixed cost TFC |
Total variable cost TVC |
Total cost (TFC + TVC) TC |
Average variable cost (TVC / Q) AVC |
Average fixed cost (TFC / Q) AFC |
Average cost (TC/Q) AC |
Marginal cost MC |
|
0 |
– |
– |
60 |
– |
– |
– |
– |
|
1 |
60 |
20 |
80 |
20 |
60 |
80 |
20 |
|
2 |
60 |
36 |
96 |
18 |
30 |
48 |
16 |
|
3 |
60 |
48 |
108 |
16 |
20 |
36 |
12 |
|
4 |
60 |
64 |
124 |
16 |
15 |
31 |
16 |
|
5 |
60 |
90 |
150 |
18 |
12 |
30 |
26 |
|
6 |
60 |
132 |
192 |
22 |
10 |
32 |
42 |
The above table represents the cost-output relationship. The table is prepared on the basis of the law of diminishing marginal returns. The fixed cost Rs. 60 May include rent of factory building, interest on capital, salaries of permanently employed staff, insurance etc. The table shows that fixed cost is same at all levels of output but the average fixed cost, i.e., the fixed cost per unit, falls continuously as the output increases. The expenditure on the variable factors (TVC) is at different rate. If more and more units are produced with a given physical capacity the AVC will fall initially, as per the table declining up to 3rd unit, and being constant up to 4th unit and then rising. It implies that variable factors produce more efficiently near a firm’s optimum capacity than at any other levels of output and later rises. But the rise in AC is felt only after the start rising. In the table ‘AVC’ starts rising from the 5th unit onwards whereas the ‘AC’ starts rising from the 6th unit only so long as ‘AVC’ declines ‘AC’ also will decline. ‘AFC’ continues to fall with an increase in Output. When the rise in ‘AVC’ is more than the decline in ‘AFC’, the total cost again begin to rise. Thus there will be a stage where the ‘AVC’, the total cost again begin to rise thus there will be a stage where the ‘AVC’ may have started rising, yet the ‘AC’ is still declining because the rise in ‘AVC’ is less than the droop in ‘AFC’.
Thus the table shows an increasing returns or diminishing cost in the first stage and diminishing returns or diminishing cost in the second stage and followed by diminishing returns or increasing cost in the third stage.
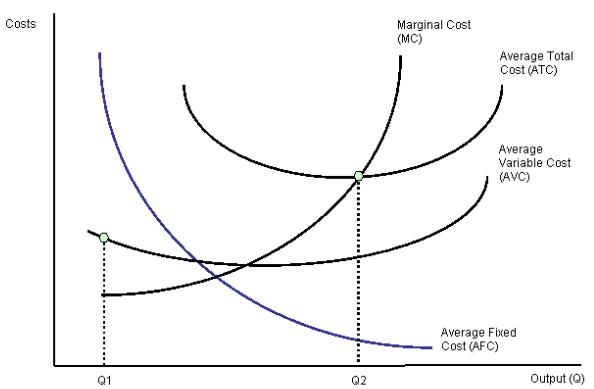
The short-run cost-output relationship can be shown graphically as follows.
In the above graph the “AFC’ curve continues to fall as output rises an account of its spread over more and more units Output. But AVC curve (i.e. variable cost per unit) first falls and than rises due to the operation of the law of variable proportions. The behavior of “ATC’ curve depends upon the behavior of ‘AVC’ curve and ‘AFC’ curve. In the initial stage of production both ‘AVC’ and ‘AFC’ decline and hence ‘ATC’ also decline. But after a certain point ‘AVC’ starts rising. If the rise in variable cost is less than the decline in fixed cost, ATC will still continue to decline otherwise AC begins to rise. Thus the lower end of ‘ATC’ curve thus turns up and gives it a U-shape. That is why ‘ATC’ curve are U-shaped. The lowest point in ‘ATC’ curve indicates the least-cost combination of inputs. Where the total average cost is the minimum and where the “MC’ curve intersects ‘AC’ curve, It is not be the maximum output level rather it is the point where per unit cost of production will be at its lowest.
The relationship between ‘AVC’, ‘AFC’ and ‘ATC’ can be summarized up as follows:
-
- If both ‘AFC’ and ‘AVC’ fall, ‘ATC’ will also fall.
- When ‘AFC’ falls and ‘AVC’ rises
- ATC’ will fall where the drop in ‘AFC’ is more than the raise in ‘AVC’.
- ‘ATC’ remains constant is the drop in ‘AFC’ = rise in ‘AVC’
- ‘ATC’ will rise where the drop in ‘AFC’ is less than the rise in ‘AVC’
2. Cost-output Relationship in the Long-Run
Long run is a period, during which all inputs are variable including the one, which are fixes in the short-run. In the long run a firm can change its output according to its demand. Over a long period, the size of the plant can be changed, unwanted buildings can be sold staff can be increased or reduced. The long run enables the firms to expand and scale of their operation by bringing or purchasing larger quantities of all the inputs. Thus in the long run all factors become variable.
The long-run cost-output relations therefore imply the relationship between the total cost and the total output. In the long-run cost-output relationship is influenced by the law of returns to scale.
In the long run a firm has a number of alternatives in regards to the scale of operations. For each scale of production or plant size, the firm has an appropriate short-run average cost curves. The short-run average cost (SAC) curve applies to only one plant whereas the long-run average cost (LAC) curve takes in to consideration many plants.
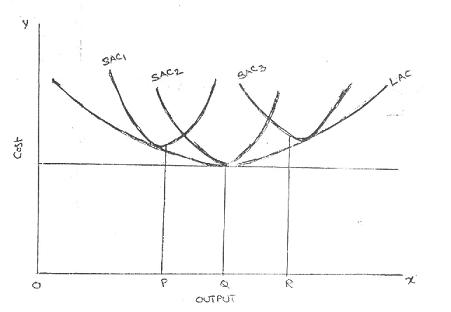
The long-run cost-output relationship is shown graphically with the help of “LCA’ curve.
To draw on ‘LAC’ curve we have to start with a number of ‘SAC’ curves. In the above figure it is assumed that technologically there are only three sizes of plants — small, medium and large, ‘SAC’, for the small size, ‘SAC2’ for the medium size plant and ‘SAC3’ for the large size plant. If the firm wants to produce ‘OP’ units of output, it will choose the smallest plant. For an output beyond ‘OQ’ the firm wills optimum for medium size plant. It does not mean that the OQ production is not possible with small plant. Rather it implies that cost of production will be more with small plant compared to the medium plant.
For an output ‘OR’ the firm will choose the largest plant as the cost of production will be more with medium plant. Thus the firm has a series of ‘SAC’ curves. The ‘LCA’ curve drawn will be tangential to the entire family of ‘SAC’ curves i.e. the ‘LAC’ curve touches each ‘SAC’ curve at one point, and thus it is known as envelope curve. It is also known as planning curve as it serves as guide to the entrepreneur in his planning to expand the production in future. With the help of ‘LAC’ the firm determines the size of plant which yields the lowest average cost of producing a given volume of output it anticipates.
Download Presentation: Cost-Output Relationship(pptx)

